
The FDA quality metrics program is a proposed CDER reporting program that would have drug manufacturers send FDA data on their own manufacturing, laboratory, quality system and supply performance, so FDA can schedule inspections by risk and spot shortage risks earlier. As of October 2026 it is still a proposal: no establishment is required to report quality metrics to FDA.
FDA has rewritten the program three times since 2015. The current direction, published in March 2022, drops fixed metric definitions and asks each facility to pick its own metrics in four practice areas. Below we set out that direction, how it differs from Quality Management Maturity (QMM), and what FDA investigators actually cite in each practice area, using 779 human drug Form 483s from the Atlas directory (release of August 15, 2026, forms issued January 2025 to June 2026).
- FDA's July 2015 draft guidance "Request for Quality Metrics" proposed mandatory, product-level reporting of four metrics.
- The November 2016 revised draft "Submission of Quality Metrics Data" moved to a voluntary first phase and cut the list to three metrics: lot acceptance rate, product quality complaint rate and invalidated out-of-specification rate.
- FDA's March 9, 2022 Federal Register notice (Docket FDA-2022-N-0075) proposed four practice areas: Manufacturing Process Performance, PQS Effectiveness, Laboratory Performance and Supply Chain Robustness.
- CDER's QMM prototype assessment program is a separate, voluntary program; its third cohort, announced February 11, 2026, took requests from up to nine establishments through April 13, 2026.
- In the Atlas directory, 45% of 779 human drug Form 483s citing Part 211 from January 2025 to June 2026 cite 21 CFR 211.22 (quality unit), and 38% cite 21 CFR 211.192 (investigations).
What is the FDA quality metrics program?
The FDA quality metrics program is CDER's plan to collect quality performance data from drug establishments between inspections. FDA says it would use the data to set risk-based inspection schedules, reduce the frequency or length of surveillance inspections for facilities whose metrics suggest sustainable compliance, and identify products at risk of quality-related shortages and recalls.
The program has a long paper trail. Each step changed what FDA would ask for and whether it would be optional:
| Year | FDA action | What it proposed |
|---|---|---|
| 2013 | Request for public input (78 FR 9928) | Whether and how FDA should use quality metrics |
| July 2015 | Draft guidance "Request for Quality Metrics" (80 FR 44973) | Mandatory, product-based reporting of lot acceptance rate, product quality complaint rate, invalidated OOS rate and APR on-time rate |
| November 2016 | Revised draft "Submission of Quality Metrics Data" (81 FR 85226) | Voluntary first phase, establishment or product reporting, three metrics |
| June 29, 2018 | Two pilot programs (83 FR 30751, 83 FR 30748) | Quality Metrics Site Visit Program (FDA toured 14 establishments) and Quality Metrics Feedback Program |
| March 9, 2022 | Public docket FDA-2022-N-0075, comments to June 7, 2022 | Four practice areas, firm-chosen metrics, establishment-level reporting |
Covered establishments under the 2016 draft, which FDA kept in 2022, include manufacturers of drugs under an NDA, ANDA or BLA, nonprescription monograph drugs, unapproved marketed drugs and their APIs, plus contract laboratories, sterilizers and packagers. FDA's Quality Metrics for Drug Manufacturing page keeps the full history.
Is FDA quality metrics reporting mandatory?
FDA quality metrics reporting is not mandatory in 2026. The 2015 draft proposed a mandatory program, industry raised burden and legal objections, and the 2016 revision switched to a voluntary first phase. FDA's program page, last updated in December 2025, still describes a reporting program FDA is "proposing to develop and implement", with no final guidance and no reporting deadline.
Two things are easy to confuse here. CGMP rules already require the raw data behind most metrics: 21 CFR 211.180(e) requires an annual product review, 211.192 requires written investigations of discrepancies and failures, and 211.198 requires complaint files. FDA can read all of that on inspection. What is optional is sending a structured metrics package to FDA between inspections.
The second confusion is QMM, which is also voluntary but is a different program. It is covered two sections down.
What are the four practice areas FDA proposed in 2022?
The four practice areas in FDA's 2022 proposal are Manufacturing Process Performance, PQS Effectiveness, Laboratory Performance and Supply Chain Robustness. A facility would choose at least one metric from each area and tell FDA how it calculated it. FDA would not fix the definitions, because its pilots showed that different sectors already track different metrics.
These are the example metrics FDA listed in the March 2022 Federal Register notice:
| Practice area | Example metrics FDA named | What the metric shows |
|---|---|---|
| Manufacturing Process Performance | Process capability (Cpk/Ppk), lot acceptance rate, right-first-time rate, lot release cycle time | Whether the process makes good lots without rework or deviation |
| PQS Effectiveness | CAPA effectiveness, repeat deviation rate, change control effectiveness, overall equipment effectiveness, unplanned maintenance | Whether the quality system fixes problems so they stay fixed |
| Laboratory Performance | Adherence to lead time, laboratory right-first-time rate, invalidated OOS rate, calibration timeliness | Whether testing is accurate, on time and free of avoidable error |
| Supply Chain Robustness | On-time in-full, fill rate, disposition on time, days of inventory on hand | Whether product reaches patients when it is needed |
The notice also explains why FDA moved away from its 2016 list. Pilot participants found that lot acceptance rate and invalidated OOS rate barely vary over time and can raise false alarms, and that rates calculated on the 2016 definitions could exceed 100 percent when lots are dispositioned in a different quarter from when they started. FDA's answer was flexibility, plus a preference for reading a combination of metrics rather than one number per area.
Quality metrics vs QMM: what is the difference?
Quality metrics and Quality Management Maturity are two separate CDER programs. Quality metrics are numbers a facility would report about its performance. QMM is an on-site assessment of how mature a facility's quality management practices are, scored against an FDA protocol. FDA's program page describes effective use of quality metrics as one sign of a mature facility, so the two meet, but neither depends on the other.
| Quality metrics program | QMM prototype assessment program | |
|---|---|---|
| Run by | CDER | CDER |
| Status in 2026 | Proposed; no final guidance | Voluntary prototype, third year |
| What FDA receives | Metric values and how each was calculated | An assessment of practices against a protocol |
| Who takes part | Any covered establishment, once launched | Up to nine establishments per cohort, by request |
| Key notices | 2015 and 2016 draft guidances; March 9, 2022 docket | Program notices in January 2024, April 23, 2025 and February 11, 2026 |
| Stated goals | Risk-based inspection scheduling, shortage prediction | Foster quality culture, recognize advanced establishments, identify improvement areas, reduce availability risk |
The February 11, 2026 notice (Docket FDA-2023-N-5706) announced the third year of the Voluntary QMM Prototype Assessment Protocol Evaluation Program, open to up to nine establishments, with requests accepted through April 13, 2026. That window has closed. CDER's Quality Management Maturity page lists the white papers from April 2022 and August 2023 that describe the practice areas QMM assesses.
What do FDA investigators cite in each practice area?
FDA investigators cite the quality unit and investigations sections most often, which maps to the PQS Effectiveness practice area. We matched each practice area to the 21 CFR Part 211 sections that police it and counted how often each appears. The sample is every human drug Form 483 in the Atlas directory issued from January 1, 2025 to June 30, 2026 (release of August 15, 2026): 1,078 forms, of which 779 cite at least one Part 211 section. The rest are mostly clinical investigator forms under Part 312.
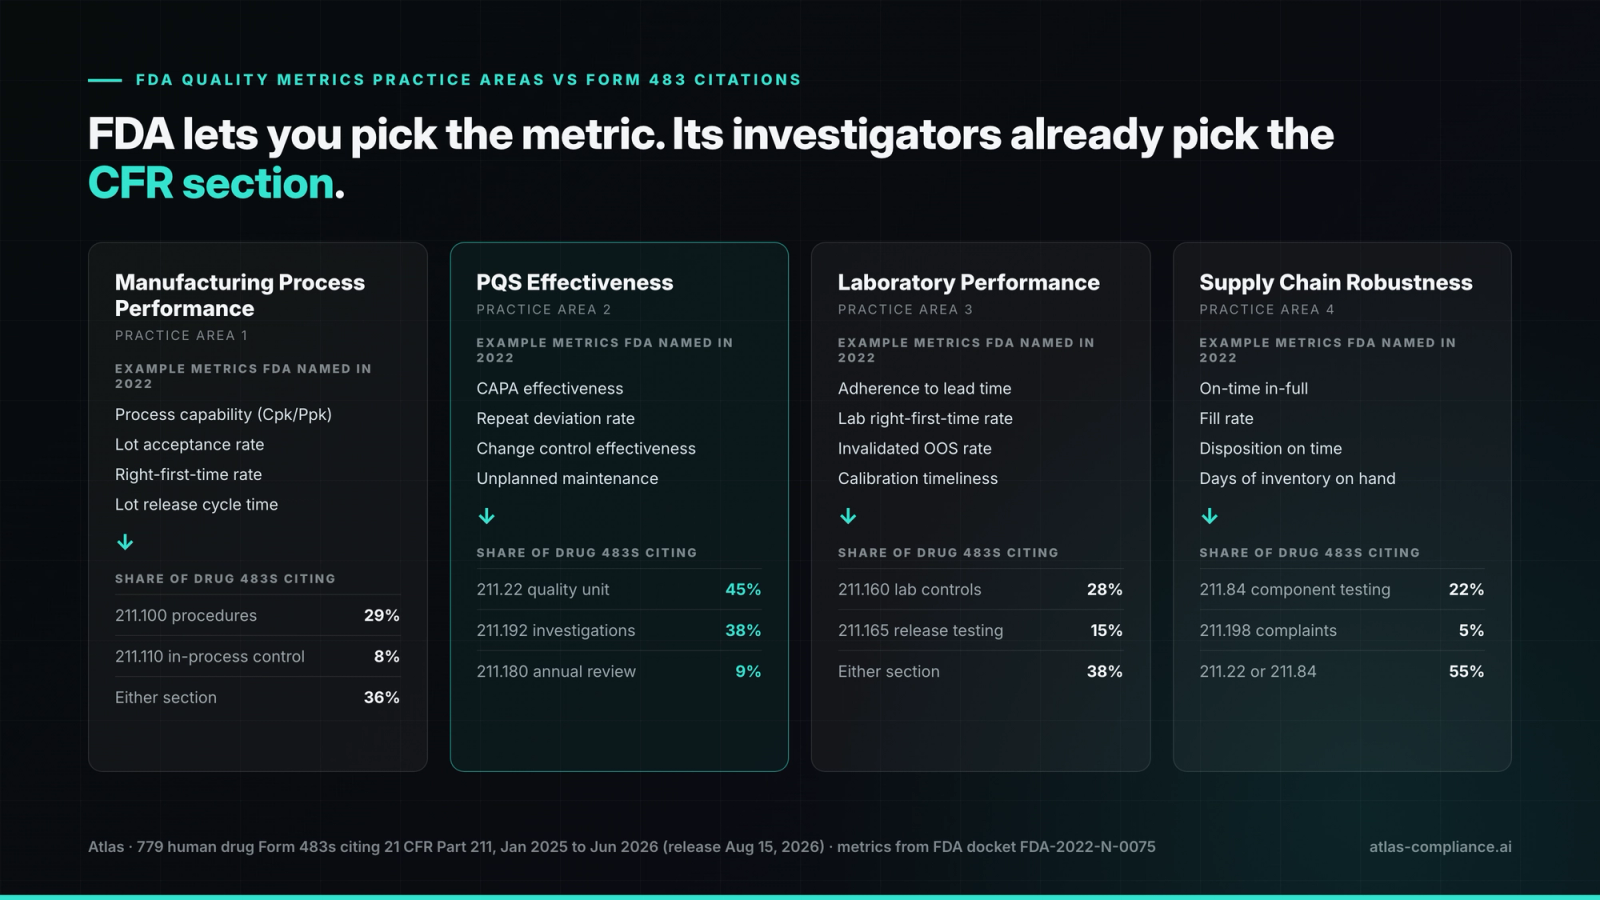
| Practice area | CFR sections that test it | Share of the 779 Form 483s |
|---|---|---|
| PQS Effectiveness | 211.22 quality unit responsibilities | 45% |
| PQS Effectiveness | 211.192 production record review and investigations | 38% |
| PQS Effectiveness | 211.180 records and annual product review | 9% |
| Manufacturing Process Performance | 211.100 written procedures, deviations | 29% |
| Manufacturing Process Performance | 211.110 in-process sampling and control | 8% |
| Laboratory Performance | 211.160 laboratory controls | 28% |
| Laboratory Performance | 211.166 stability testing | 18% |
| Laboratory Performance | 211.165 testing and release | 15% |
| Supply chain | 211.84 testing of components and containers | 22% |
| Supply chain | 211.198 complaint files | 5% |
Grouped by area, 36% of the forms cite 211.100 or 211.110, 38% cite 211.160 or 211.165, and 55% cite either 211.22 or 211.84. Equipment sections that sit behind the unplanned maintenance metric are frequent as well: 211.67 cleaning and maintenance on 31%, 211.68 automatic equipment on 21%. Every number here comes from the observation-level CFR citations on each form in the FDA Form 483 database.
Four recent forms show what a metric gap looks like when an investigator writes it up:
- PQS Effectiveness: the Lonza Bend Form 483 of May 19, 2026 has a single observation, under 211.192, on investigations of discrepancies and failures. A repeat deviation rate is the metric that would surface that before an investigator does.
- Laboratory Performance: the Eurofins Lancaster Laboratories Form 483 of August 26, 2025 cites 211.165(b) on microbiological testing and 211.192 for an incomplete written investigation record, at a contract laboratory, one of the covered establishment types.
- Supply chain: the Novel Laboratories (Lupin Somerset) Form 483 of April 17, 2026 cites 211.84(b) on representative samples of incoming components, alongside 211.192 and 211.22(d).
- Manufacturing Process Performance: the Teva Womens Health Form 483 of March 20, 2026 in Cincinnati cites 211.110(a), control procedures to monitor and validate process performance, and 211.22(d).
The pattern is consistent. Investigators rarely cite the process or the lab alone; 211.192 or 211.22 rides along, because a failed batch or a bad test result becomes a quality system finding once the investigation falls short.
 Atlas
See what the FDA knows about your next investigator.
30 minutes with the founder. No pitch deck.
Which quality metrics should a pharma site track?
A pharma site should track at least one metric per FDA practice area, chosen so that each pair of metrics can catch the other gaming the number. FDA's own pilot lesson was that single metrics such as lot acceptance rate mislead. Read them in pairs: one metric for speed or volume, one for whether the result held.
| Pair to read together | What a bad combination means | Section FDA cites when it goes wrong |
|---|---|---|
| CAPA on-time closure vs repeat deviation rate | CAPAs close on time but the same root cause returns | 211.192 (38%) |
| OOS rate vs invalidated OOS rate | Few OOS results because many are invalidated as lab error | 211.192 and 211.165 |
| Lot acceptance rate vs right-first-time rate | Lots pass only after reprocessing or deviations | 211.100 (29%) |
| On-time delivery vs component lot acceptance | Shipments are on time but incoming lots fail or skip testing | 211.84 (22%) |
| Calibration timeliness vs unplanned maintenance | Calibrations are on schedule while breakdowns rise | 211.67 (31%) and 211.68 (21%) |
Our guides go deeper on two of these pairs: CAPA effectiveness checks and metrics covers recurrence measures, and OOS meaning and OOS vs OOT covers when an invalidation holds up.
For the supply chain area, a single delivery metric says little about risk. A supplier risk score that quality teams can defend has three inputs:
- Performance: lot acceptance at incoming inspection, on-time in-full, and open supplier corrective action requests.
- Compliance history: the supplier's FDA inspection outcomes, the date of its last Form 483, and which CFR sections it was cited under.
- Criticality: what the material does in the product, whether it is single-sourced, and how long requalifying an alternate would take.
Score each input low, medium or high and act on the highest, not the average; a critical, single-source supplier with a fresh 483 under 211.192 needs attention even when its deliveries are perfect. Our pieces on supplier qualification and the SCAR process cover the first and third inputs.
AtlasFDA Inspection Intelligence Digest
We track every 483, EIR, and warning letter the moment it happens. Get the signals before they hit the FDA website.
Frequently asked questions
The November 2016 revised draft guidance "Submission of Quality Metrics Data" requested three metrics: lot acceptance rate to measure manufacturing process performance, invalidated out-of-specification rate to measure laboratory performance, and product quality complaint rate to measure patient or customer feedback. It dropped the APR on-time rate that the July 2015 draft had included, and made the first phase of reporting voluntary.

Written by
Bhavish Agarwal
Founder, Atlas
Bhavish Agarwal is the founder of Atlas and previously worked at Google and Microsoft. He has spent the past several years building regulatory data infrastructure for the pharmaceutical industry.